The graphs show the energy consumption of a simple single-family home with roughly 150 sq m.
The collection of data is still manual. You can nicely recognise the seasonal changes in energy consumption
for heating and also electricity mostly due to more light bulbs used.
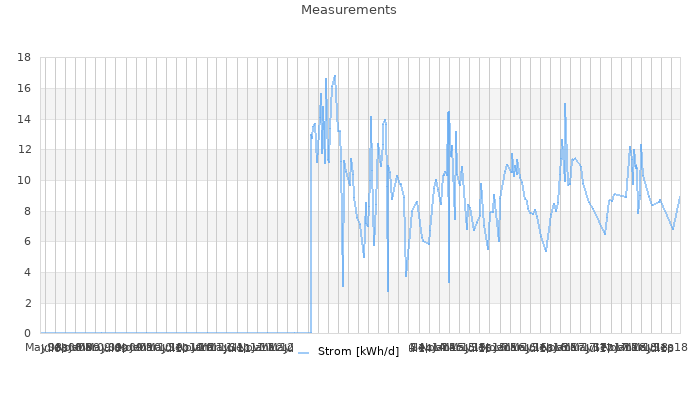
The first graph shows the actually measurements. They are taken irregularly.
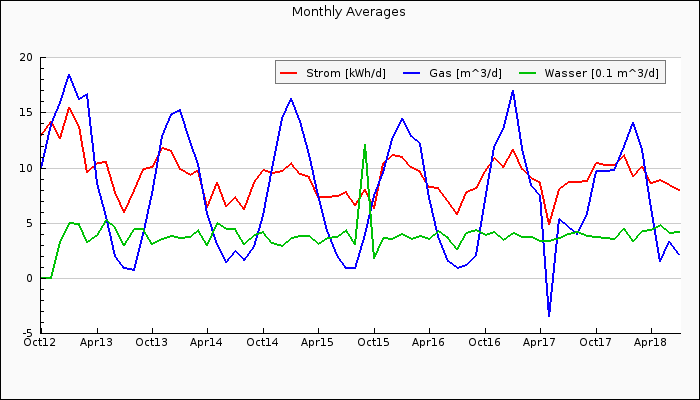
This graph depicts the averages per month
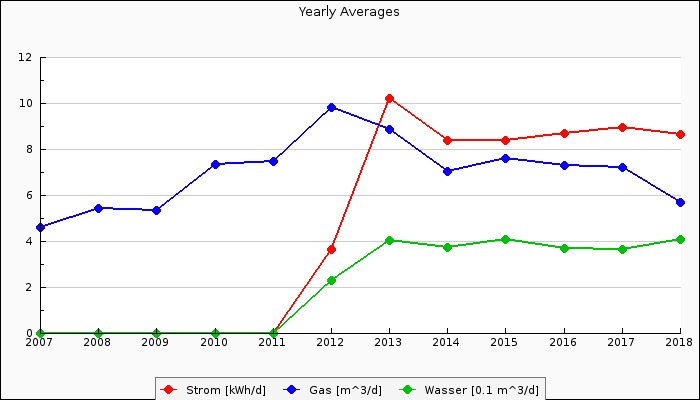
This graphs shows the annual averages. Here data from times when we lived in rented flats are included.
Therefore some data was not available.
To refresh click the submit buttom